Silber: The antithesis of the current madness.
Purpose
The precious metal silver is an underestimated metal that is used in many applications. Silver has greater color brightness, polishability and reflectivity than other precious metals and also outperforms them in terms of electrical conductivity and thermal conductivity. Silver is easy to process and only reacts chemically with a few substances such as sulphur and sulphur derivatives. Silver is almost exclusively used as an alloy with copper, as silver is too soft in its pure form. Looking at the high demand for silver in industry, it quickly becomes clear that the ...
The precious metal silver is an underestimated metal that is used in many applications. Silver has greater color brightness, polishability and reflectivity than other precious metals and also outperforms them in terms of electrical conductivity and thermal conductivity. Silver is easy to process and only reacts chemically with a few substances such as sulphur and sulphur derivatives. Silver is almost exclusively used as an alloy with copper, as silver is too soft in its pure form. Looking at the high demand for silver in industry, it quickly becomes clear that the silver price trend is very strongly linked to industrial demand. In such a case, the current silver price can also move accordingly. Silver is often produced during the extraction of base metals; in its pure form, the white precious metal is even rarer than gold. Instead, around 70 percent of silver production comes from copper, lead and zinc mining. In nature, silver ores are often interspersed with lead ores, meaning that only around 20,000 tons of silver are extracted worldwide each year.
Some areas of application for silver: batteries, solar panels, media storage, cosmetics, antibacterial products (e.g. medical gowns), stained glass, 3D printing, water purification, detergents, plastics, automotive industry, RFID chips, photography, food industry.
The price of silver has been rising steadily for several years, as the supply of silver cannot meet the high and rising demand. Mexico, Peru and Australia are considered the most important producers of silver. However, silver is also produced in China, Poland, Russia, Canada and the USA. The most important trading venues for silver are the New York Mercantile Exchange (COMEX division), the Tokyo Commodity Exchange, the Chicago Board of Trade and the London Bullion Market. The total value of silver traded on the exchange is estimated at around USD 17 billion.
Analysis
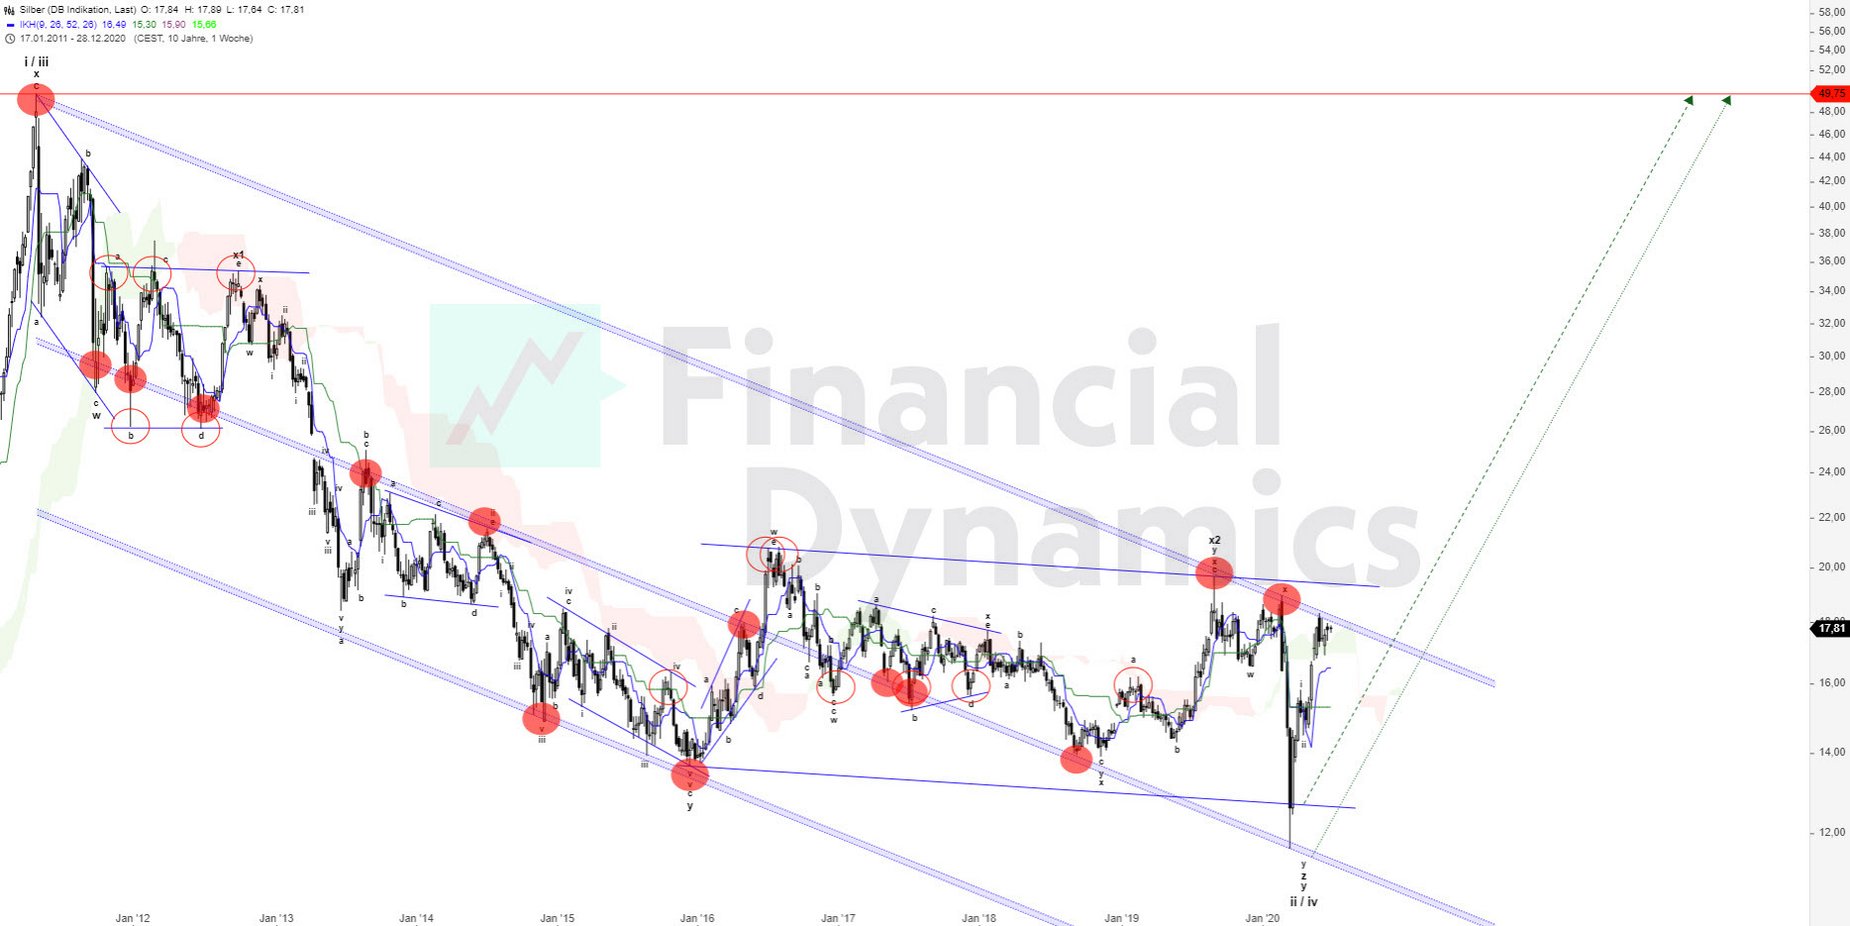
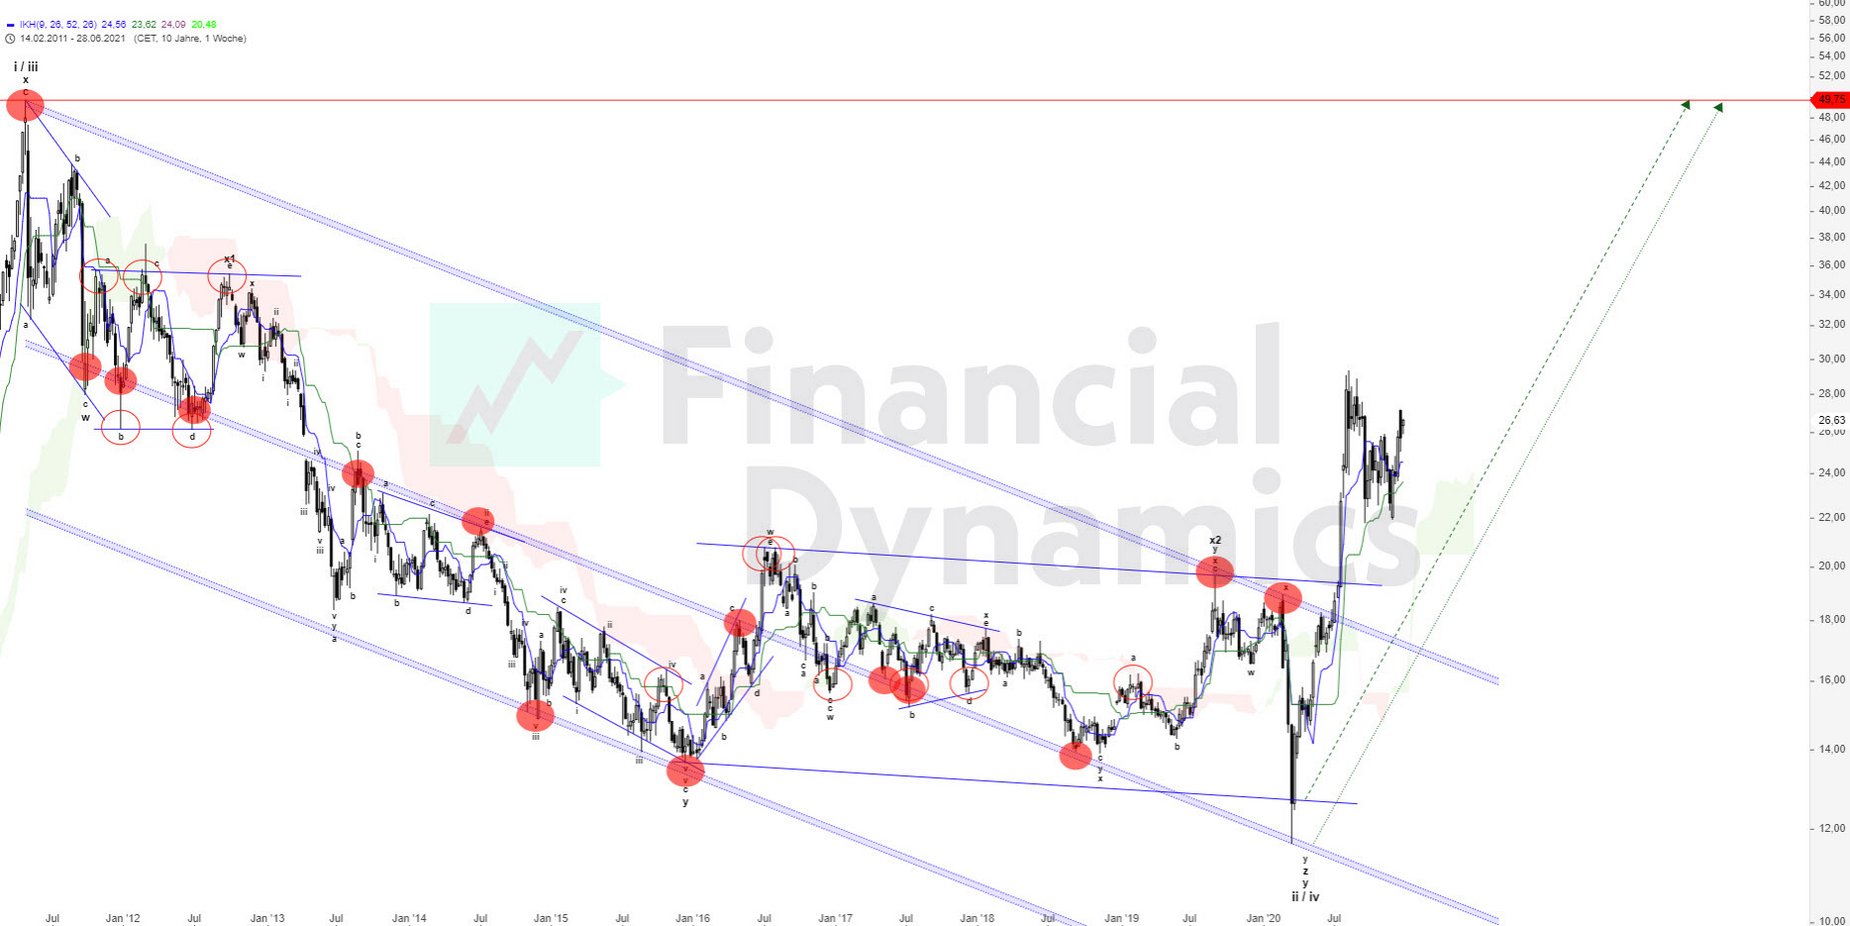
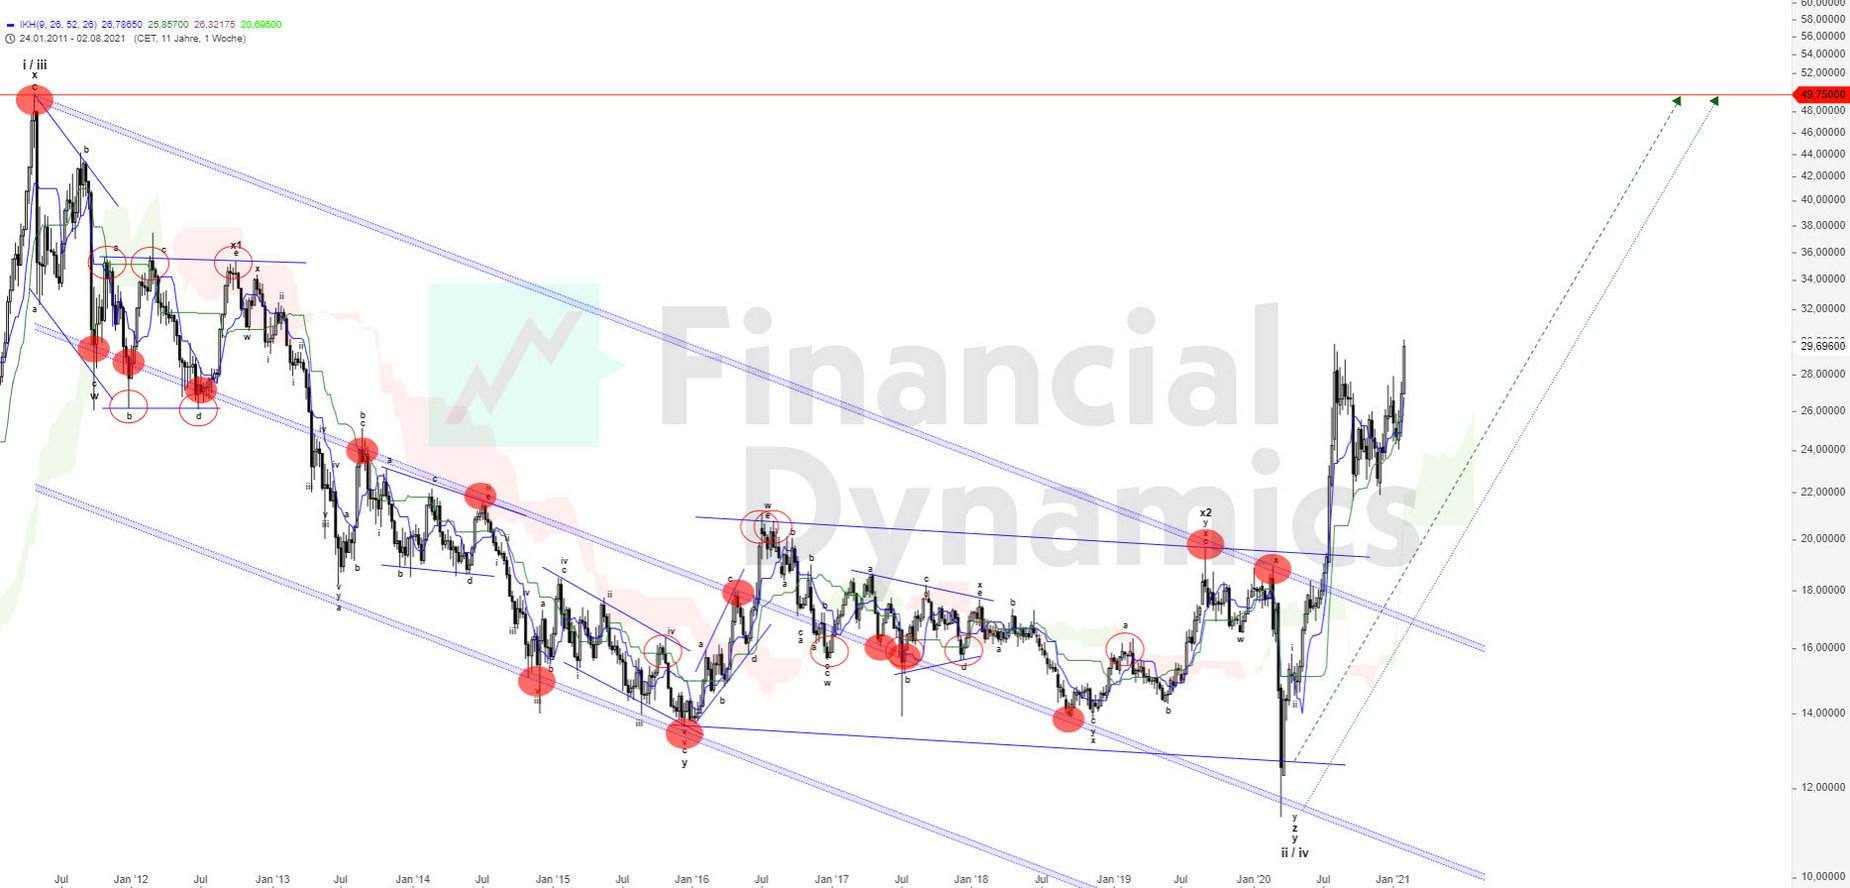
The price of silver has remained below the magical USD 50 mark for 40 years now. In 1980 and then 31 years later, in 2011, this price range was only reached for a very short time. Since the high in April 2011, the silver price has mostly only known one direction, and that is down. The price of silver fell from almost USD 50 to just under USD 11.50 in the short term during the deflationary “corona crash”. With this price decline, silver worked off a worst-case price target that had been in place for years. Since then, the silver price has risen by over 60 % at its peak.
...The price of silver has remained below the magical USD 50 mark for 40 years now. In 1980 and then 31 years later, in 2011, this price range was only reached for a very short time. Since the high in April 2011, the silver price has mostly only known one direction, and that is down. The price of silver fell from almost USD 50 to just under USD 11.50 in the short term during the deflationary “corona crash”. With this price decline, silver worked off a worst-case price target that had been in place for years. Since then, the silver price has risen by over 60 % at its peak.
According to the Elliott Wave Theory, reaching the worst-case target completed a cycle and a new bull market should have begun in March 2020, with price targets of well over USD 50 for the next few years. The silver price is currently below a resistance bulwark. A sustained rise above the USD 19-20 area would immediately be another strong confirmation signal that a new bull market has begun in the silver price. Only a fall below USD 14.50 would destroy this scenario, at least temporarily.
The Renko chart in conjunction with the MACD indicator has reached the overbought zone, but could continue to rise directly to the old extremes after a short breather. The Renko itself has generated an initial small sell signal, as it did in the 15 USD range. However, this signal should not be given too much importance in the current situation.
If we look at the very long-term chart of silver with the MACD indicator in the attached chart, we can see that the major upward phases should still lie ahead of us. At the moment, the MACD is struggling with the neutral level. We had a similar situation in 2003 in the monthly chart. What happened to the silver price afterwards can be seen from the chart.
The CoT data do not give much cause for concern at the moment. Although the commercials are in a net short position, this is not nearly as extreme in a historical context. It should also be noted at this point that commercials are never actually net long.
According to seasonality, a very positive phase for silver begins at the end of June / beginning of July. Statistically, this phase will last until the end of September. We are therefore trying to sound out a potential low in the current phase.
In 2019, global silver production fell to its lowest level since 2013, while at the same time central banks' global balance sheets expanded significantly. The M2 money supply (M2: M1 plus savings, time deposits up to USD 100,000 and certain money market fund shares) of the world's most important central bank, the Fed, will rise to over USD 19 trillion, more than double the USD 50 at the peak of the silver price in April 2011. At the peak of the silver price in 1980, the FED's balance sheet total was not even USD 0.5 trillion. One of the main reasons why there is currently no noticeable inflation is that most of the expansion in the money supply is flowing into financial assets. There it has no major impact on the velocity of money in circulation. If we look at the attached chart, we can see that money velocity remains at an all-time low.
Conclusion
- In the BIG PICTURE, everything has been going according to plan for silver since the brief slide below the USD 11.50 mark.
- As long as the USD 14.50 mark is not breached, further rises are to be preferred.
- According to Elliott wave theory, price targets for the next few years are well above USD 50. Updates will follow as soon as relevant price patterns form.
Silber
- VALOR 11948866
- ISIN CA85207K1075
- Author Oliver Dolezel
- Date 08.05.20
Analysis Performance
Performance since initial analysis
08.05.20


No rating available yet.
Comments
No comments yet.